

US cities with the worst traffic congestion, according to GPS data
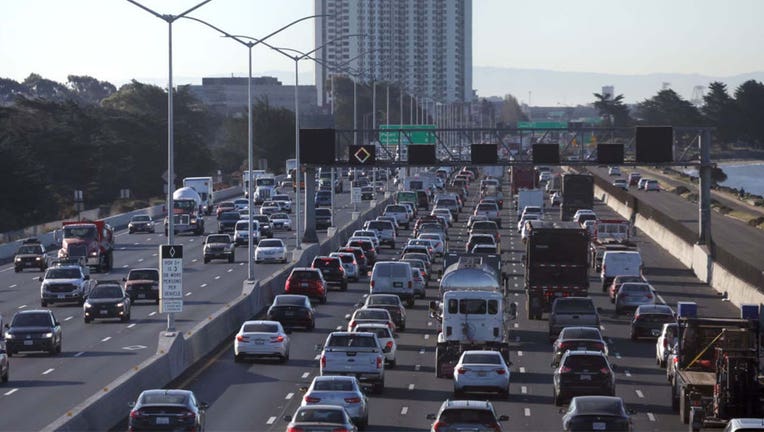
FILE - Traffic moves along Interstate 80 on Feb. 16, 2022 in Berkeley, California.
Sitting in traffic is not exactly America’s favorite pastime but man do we spend a lot of time doing it.
Tomtom, a GPS manufacturer that keeps track of traffic patterns and ranks urban congestion worldwide, created a list of cities that deal with congestion from worst to least worst because there’s no such thing as having the best traffic.
As states begin to do away with COVID-19 restrictions and companies start resuming in-office operations, congestion has unsurprisingly increased since January 2019, according to data collected by Tomtom.
Top 10 U.S. cities with worst traffic congestion in 2021
- New York City, New York: Drivers spent an extra 5 days and 3 hours sitting in rush hour traffic which was actually 20 hours less than in 2019.
- Los Angeles, California: Drivers spent an extra 4 days and 19 hours in rush hour traffic which was down 2 days and 5 hours compared to 2019.
- Miami, Florida: Drivers spent an extra 4 days and 10 hours in rush hour traffic which is down 1 day and 3 hours compared to 2019.
- Baton Rouge, Louisiana: Drivers spent an extra 4 days and 8 hours in rush hour traffic which was 15 hours less than 2019.
- San Francisco, California: Drivers spent an extra 3 days and 16 hours in rush hour traffic which was down 2 days and 11 hours compared to 2019.
- Chicago, Illinois: Drivers spent an extra 3 days and 14 hours in rush hour traffic which was down 1 day and 5 hours compared to 2019.
- Honolulu, Hawaii: Drivers spent an extra 4 days and 12 hours in rush hour traffic which was down 1 day and 12 hours compared to 2019.
- Seattle, Washington: Drivers spent an extra 3 days and 10 hours in rush hour traffic which was down 2 days and 8 hours compared to 2019.
- Riverside, California: Drivers spent an extra 3 days and 12 hours in rush hour traffic which was down 1 day and 2 hours compared to 2019.
- Philadelphia, Pennsylvania: Drivers spent an extra 3 days and 3 hours in rush hour traffic which was down 1 day and 6 hours compared to 2019.
While the top 10 cities did show increases in the amount of time people spent sitting in rush hour traffic between 2019 and 2021, the increase is still less than before the COVID-19 pandemic.
In New York, congestion levels were at 35% in 2021 which is actually down compared to 2019 which was 37%, according to Tomtom.
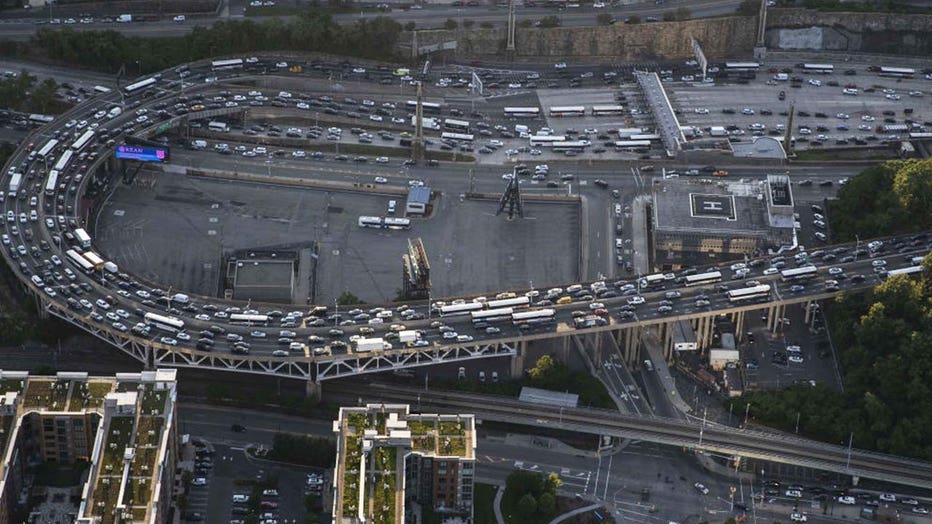
FILE - Vehicles in traffic after exiting the Lincoln Tunnel in Weehawken, New Jersey, U.S., on Thursday June 17, 2021. (Victor J. Blue/Bloomberg via Getty Images)
Congestion levels 2019 vs. 2021
Los Angeles
2019: 42%
2021: 33%
Miami
2019: 31%
2021: 28%
Baton Rouge
2019: 26%
2021: 27%
San Francisco
2019: 36%
2021: 26%
Chicago
2019: 28%
2021: 24%
Honolulu
2019: 28%
2021: 23%
Seattle
2019: 31%
2021: 23%
Riverside
2019: 26%
2021: 23%
Philadelphia
2019: 24%
2021: 22%
Total time spent in traffic on average
New York: 80 hours
Los Angeles: 75 hours
Miami: 64 hours
Baton Rouge: 62 hours
San Fransisco: 59 hours
Chicago: 55 hours
Honolulu: 52 hours
Seattle: 52 hours
Riverside: 52 hours
Philadelphia: 50 hours
Atlanta: 48 hours
Tampa: 48 hours
Cape Coral-Fort Myers: 48 hours
New Orleans: 48 hours
Washington: 48 hours
Houston: 48 hours
Charleston: 46 hours
McAllen: 46 hours
Portland: 46 hours
Fresno: 46 hours
While spending two days of your life sitting in traffic seems bad, compared to some cities in other parts of the world, 48 hours is basically nothing.
Top 10 cities in the world with the worst congestion
- Istanbul, Turkey - Total hours spent in traffic a year: 142 hours
- Moscow region, Russia - 140 hours
- Kyiv, Ukraine - 128 hours
- Bogota, Colombia - 126 hours
- Mumbai, India - 121 hours
- Odessa, Ukraine - 117 hours
- Saint Petersburg, Russia - 115 hours
- Bucharest, Romania - 115 hours
- Novosibirsk, Russia - 110 hours
- Bengaluru, India - 110 hours
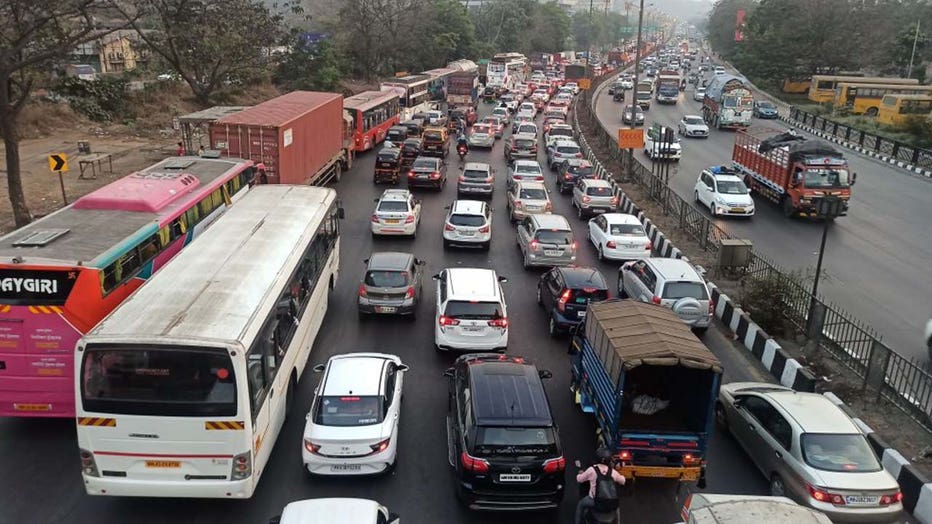
FILE - Vehicles are seen stuck in a traffic jam on a highway in Mumbai, India, Feb. 11, 2022. ( Str/Xinhua via Getty Images)
Surprisingly, despite traffic levels not yet reaching pre-pandemic levels, vehicle fatalities have seen an enormous spike in the U.S.
The nonprofit National Safety Council estimated that 42,060 people died in vehicle crashes in 2020, an 8% increase over 2019 and the first jump in four years.
The fatality rate per 100 million miles driven spiked 24%, the largest annual percentage increase since the council began collecting data in 1923.
And even though traffic is now getting close to pre-coronavirus levels, the bad behavior on the roads is continuing, authorities say.
"It’s kind of terrifying what we're seeing on our roads," said Michael Hanson, director of the Minnesota Public Safety Department’s Office of Traffic Safety. "We’re seeing a huge increase in the amount of risk-taking behavior."
Deaths in 2020 were the most since 2007 when 43,945 people were killed in vehicle crashes. In addition, the safety council estimates that 4.8 million people were injured in crashes last year.
Federal data showed that Americans drove 13% fewer miles in 2020, or roughly 2.8 trillion miles, said Ken Kolosh, the safety council’s manager of statistics. Yet the number of deaths rose at an alarming rate, he said.
"The pandemic appears to be taking our eyes off the ball when it comes to traffic safety," Kolosh said.
Transportation Secretary Pete Buttigieg is pledged to tackle rising traffic fatalities through a national strategy aimed at reducing speed, redesigning roads and enhancing car safety features such as automatic emergency braking.
Buttigieg told The Associated Press that new federal data being released next week will show another increase in traffic fatalities through the third quarter of 2021. Those numbers are expected to point to a sizable increase in deaths compared with the same period in 2020, adding to a half-year traffic death total of 20,160 that already was the highest half-year figure since 2006.
"It doesn’t look good, and I continue to be extremely concerned about the trend," Buttigieg said in an interview.
"Somehow it has become over the years and decades as normal, sort of the cost of doing business," he said. "Even through a pandemic that led to considerably less driving, we continue to see more danger on our roads."
Buttigieg said his department is embracing a new "safe system" approach urged by auto safety advocates to bolster initiatives, underway in several cities, that seek to eliminate fatalities by taking into account more than just driver behavior.
Over the next two years, he said, his department will provide guidance as well as $5 billion in grants to states to spur lower speed limits and embrace safer road design such as dedicated bike and bus lanes, better lighting and crosswalks. When roads become safer for bicyclists and pedestrians, that opens up transit options overall and can lead to fewer dangerous cars on the road, he said.
Money for the grants is included in President Joe Biden’s infrastructure law, which has an additional $4 billion in funding through the Highway Safety Improvement Program.
The Associated Press contributed to this report. This story was reported out of Los Angeles.